Q4FY2019 Result Update | Banking
Apr 30, 2019
Yes Bank
NEUTRAL
CMP
`168
Performance Highlights
Target Price
`
Particulars (` cr)
Q4FY19
Q4FY18
% chg (yoy)
Q3FY19
% chg (qoq)
Investment Period
12 Months
NII
2,506
2,154
16.3
2,666
(6.0)
Pre-prov. profit
1,323
2,135
(38.0)
1,990
(33.5)
PAT
(1,506.6)
1,179
(-)
1,002
(250.4)
Stock Info
Source: Company, Angel Research
Sector
Banking
Provision jump: Yes Bank has reported loss of `1,506cr largely driven by higher
Market Cap (` cr)
38,909
provision (increased 9x yoy) and decline in fees income. Higher Provisions were
Beta
1.1
driven by contingent provision for standard asset, on which management took
52 Week High / Low
404 / 147
upfront recognition, the size of the new stressed asset stands at `10,000cr. New
Avg. Daily Volume
29,85,114
MD, Mr. Ranveet Gill has laid out new strategy for the bank, which focuses on (a)
Face Value (`)
2
liability generation to prune cost of funds, (b) more emphasis on retail and SME
BSE Sensex
39,031
advances to increase transactional revenues from Retail/ TBG fees, and (c) risk
Nifty
11,748
normalisation.
Reuters Code
YESB.BO
Bloomberg Code
YES IN
One time reversal and conservative accounting policy for fees income: During the
quarter, bank has reversed `280cr of fees income and adopted conservative policy
for (up fronting to amortisation) fees recognition.
Shareholding Pattern (%)
Loan growth moderates; NIM compressed to
3.10%: Loan book growth
Promoters
19.8
moderated to 18.7% yoy (declined 1% qoq), of which retail book increased by
MF / Banks / Indian Fls
21.6
63% yoy to constitute 17% of total advances. NIM compressed by 30bps/20bps
FII / NRIs / OCBs
36.2
yoy/qoq to 3.10%, led by `100cr of interest income reversal during quarters
(higher slippages). Deposits grew moderately 13.4% yoy (2.2% qoq) largely driven
Indian Public / Others
22.5
by term deposit (19.4% yoy). CASA deposits barely grew at 2.8%, while the CASA
ratio declined 339bps yoy to 33.1%.
Abs. (%)
3m 1yr 3yr
Slippages & Provision jumped 9x yoy: During the quarter, two large accounts from
Sensex
6.7
13.1
52.4
airlines (`552cr), residual exposure of IL&Fs (`529cr) and lumpy real estate
exposure slipped. The bank has created contingency provision of
`2,100cr
Yes Bank
(12.5)
(48.3)
(11.0)
towards identified ‘Stressed but Performing’ accounts (`10,000cr).
Outlook & Valuation: We have neutral view on YES Bank considering (a) low CET
of 8.4%, for growth, bank will have to raise capital at current low valuation, (b)
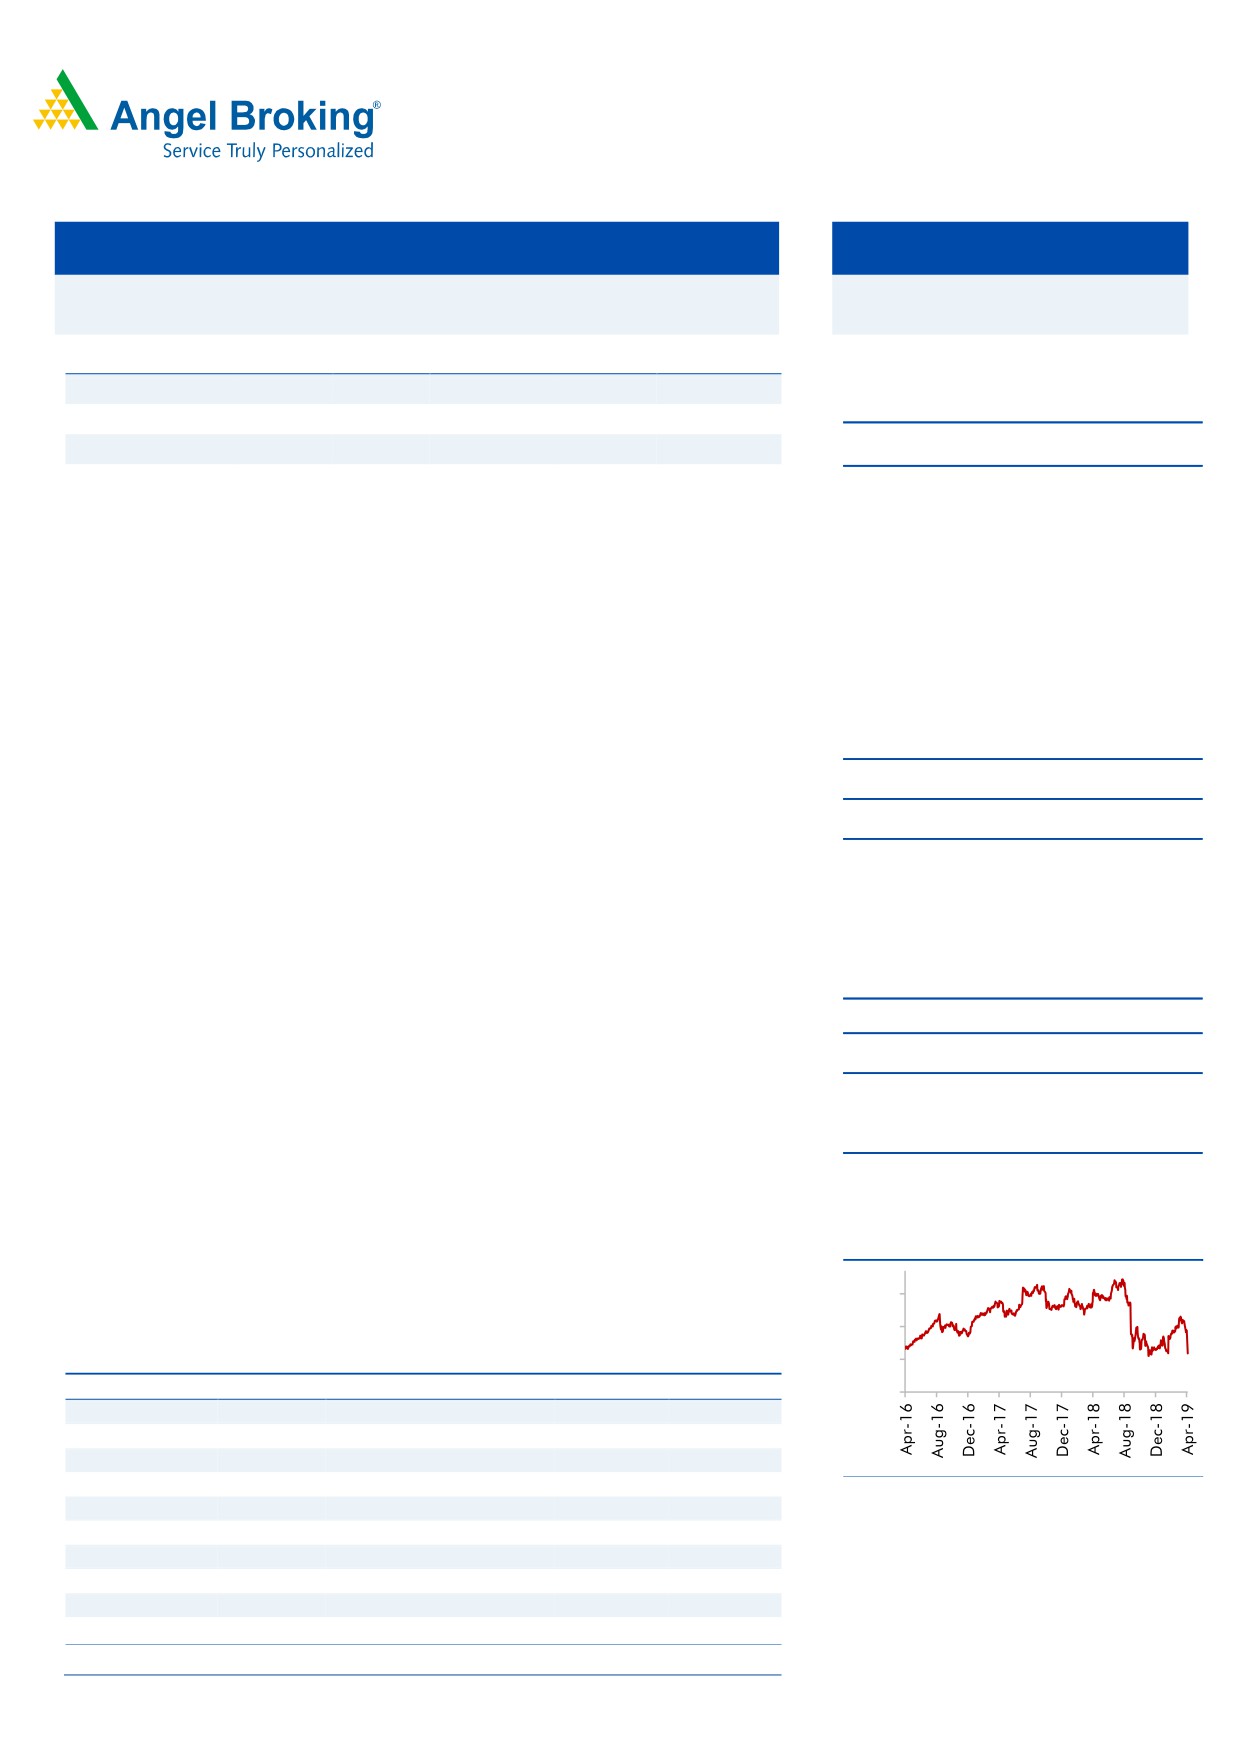
3-year price chart
uncertainty related to newly identified stressed asset, (c) new MD strategy to move
350
towards building a strong retail franchise and corporate governance/transparency,
which will moderate balance sheet growth.
250
Key financials (Standalone)
150
Y/E March (` cr)
FY17
FY18
FY19
FY20E
FY21E
50
NII
5,797
7,737
9,809
10,816
12,183
% chg
27
33
27
10
13
Net profit
3,330
4,225
1,720
2,617
3,426
% chg
31
27
(59)
52
31
Source: Company, Angel Research
NIM (%)
3.4
3.3
3.1
3.0
2.9
EPS ( Rs)
14
18
7
11
15
Jaikishan Parmar
P/E (x)
12
9
22
15
11
Research Analyst
P/ABV (x)
1.8
1.5
1.6
1.4
1.3
022 - 39357600 Ext: 6810
RoA (%)
1.8
1.6
0.5
0.6
0.7
RoE (%)
19
18
7
9
11
Source: Company, Angel Research, Note: CMP as of 30/04/19
Please refer to important disclosures at the end of this report
1
Yes Bank | Q4FY2019 Result Update
Exhibit 1: 4QFY2016 performance summary (standalone)
Particular (` Cr)
Q1FY18
Q2FY18
Q3FY18
Q4FY18
Q1FY19
Q2FY19
Q3FY19
Q4FY19
% qoq
% yoy
Interest Earned
4,654
4,800
5,070
5,743
6,578
7,231
7,959
7,857
(1)
37
on Advances / Bills
3,534
3,693
3,846
4,404
5,005
5,550
6,248
6,120
(2)
39
on investments
903
923
1,098
1,179
1,351
1,561
1,604
1,533
(4)
30
on balance with RBI & others
179
145
82
110
162
58
42
136
226
24
on others
37
40
44
50
60
62
65
68
5
38
Interest Expended
2,845
2,915
3,182
3,589
4,359
4,814
5,293
5,351
1
49
Net Interest Income
1,809
1,885
1,889
2,154
2,219
2,418
2,666
2,506
(6)
16
Other Income
1,132
1,248
1,422
1,421
1,694
1,473
891
532
(40)
(63)
Operating income
2,941
3,134
3,311
3,575
3,913
3,891
3,557
3,038
(15)
(15)
Operating Expenses
1,237
1,227
1,309
1,440
1,459
1,525
1,567
1,714
9
19
Employee expenses
546
563
533
547
591
594
625
660
6
21
Other Opex
691
664
776
893
868
931
942
1,054
12
18
Pre Provision Profit
1,704
1,907
2,002
2,135
2,455
2,366
1,990
1,323
(34)
(38)
Provisions & Contingencies
286
447
421
400
626
940
550
3,662
565
816
PBT
1,418
1,460
1,580
1,736
1,829
1,427
1,440
(2,338)
(262)
(235)
Provision for Taxes
453
457
504
556
569
462
438
(832)
(290)
(249)
Tax rate
32
31
32
32
31
32
30
36
PAT
966
1,003
1,077
1,179
1,260
965
1,002
(1,507)
-
-
Business Details
Advance
1,39,972
1,48,675
1,71,515
2,03,534
2,14,720
2,40,000
2,43,885
2,41,500
(1.0)
18.7
YoY
32
35
46
54
53
61
42
19
Borrowing
38,302
44,830
56,302
74,894
78,790
1,01,660
1,07,691
1,08,424
0.7
44.8
Deposit
1,50,241
1,57,990
1,71,731
2,00,738
2,13,395
2,22,838
2,22,758
2,27,610
2.2
13.4
CA
18,773
19,966
22,604
28,826
28,333
25,941
29,538
28,500
(3.5)
(1.1)
SA
36,442
38,758
42,685
44,351
46,598
49,339
44,579
46,753
4.9
5.4
CASA
55,215
58,725
65,289
73,176
74,930
75,279
74,117
75,253
1.5
2.8
CASA %
37
37
38
36
35.1
33.8
33.3
33.1
(21)bp
(339)bp
Asset Quality
GNPA
1,364
2,720
2,974
2,627
2,824
3,866
5,159
7,883
52.8
200.1
NNPA
545
1,543
1,595
1,313
1,263
2,019
2,876
4,485
55.9
241.6
Gross NPAs (%)
0.97
1.82
1.72
1.28
1.31
1.60
2.10
3.22
112bp
194bp
Net NPAs (%)
0.39
1.04
0.93
0.64
0.59
0.84
1.18
1.86
68bp
122bp
PCR (Calculated, %)
60
43
46
50
55
48
44
43
(114)bp
(692)bp
Credit Cost (Annualised) Adv
0.82
1.20
0.98
0.79
1.17
1.57
0.90
6.06
516bp
528bp
Slippages
490
380
560
1,630
2,297
3,481
51.5
816.1
Profitability ratios (%)
pbs
bps
C/I
42.1
39
40
40
37.3
39.2
44.0
56.4
1239
1616
RoE
17
18
18
19
19
14
14
(22)
(3617)
(4055)
Yield on Advance
10.4
10.2
9.6
9.4
9.6
9.8
10.3
10.1
(24)
69
Cost of Fund
6.2
6.0
5.9
5.7
6.1
6.2
6.5
6.4
(4)
72
Spread
4.2
4.3
3.7
3.7
3.4
3.5
3.9
3.7
(20)
(3)
NIM Reported
3.7
3.7
3.5
3.4
3.30
3.30
3.30
3.10
(20)
(30)
Cal NIM
3.9
3.8
3.4
3.4
3.1
3.1
3.2
3.0
(20)
(34)
Source: Company, Angel Research
Apr 30, 2019
2
Yes Bank | Q4FY2019 Result Update
Exhibit 2: Asset Quality deteriorated led by higher slippages (Airline Co and IL&FS)
Asset Quality
Q1FY18
Q2FY18
Q3FY18
Q4FY18
Q1FY19
Q2FY19
Q3FY19
Q4FY19
% qoq
% yoy
Gross NPA
1,364
2,720
2,974
2,627
2,824
3,866
5,159
7,883
52.8
200.1
Net NPA
545
1,543
1,595
1,313
1,263
2,019
2,876
4,485
55.9
241.6
Gross NPA %
0.97
1.82
1.72
1.28
1.31
1.60
2.10
3.22
112bp
194bp
Net NPA %
0.39
1.04
0.93
0.64
0.59
0.84
1.18
1.86
68bp
122bp
Provision Coverage%
60.0
43.3
46.4
50.0
55.3
47.78
44.24
43.11
(114)bp
(692)bp
Restructured Advances %
0.24
0.08
0.05
0.04
0.00
0.08
0.09
0.08
(1)bp
4bp
Security Receipt (Net) %
0.69
0.94
1.06
0.92
0.82
0.85
0.71
0.71
0bp
(21)bp
Standard SDR
0.20
0.32
0.21
-
-
0bp
0bp
5:25 Refinancing
0.10
0.15
0.06
0.05
0.05
0bp
(5)bp
S4A/BBB
0.01
0.01
0.09
0.07
0.07
0bp
(7)bp
New Indentified Stressed asset
4.14
414bp
414bp
Total Stressed asset
1.63
2.54
2.40
1.72
1.53
1.77
1.98
6.79
481bp
507bp
Provisions jumped 9x yoy and Slippages also spiked by 9x yoy.
During the quarter, two large accounts from airlines (`552cr), residual exposure of
IL&Fs (`529cr) and lumpy real estate exposure slipped. Along with this, bank has
taken contingent provision to the tune of `2,100cr on standard assets, which are
not stressed assets.
Absolute GNPA increased 52% qoq to `7,883cr, while NPA inched up by 55% qoq
to `4,485cr with provision coverage declining by 114bps to 43% (Calculated).
Total net stressed loans (NNPA, OSRL, identified stressed advance) stood at 6.79%,
increased from 1.98% in Q3FY2019.
The bank has an aggregate outstanding funded exposure of `2,528cr as of March
31, 2019 (IL&FS), of which `2,442cr has been classified as NPA. Further, `86cr
continues to be classified as ‘Standard’ in-line with the NCLAT order dated
February 25, 2019. The bank has a provision of 15% against this Standard
exposure.
Further, SMA 2 outstanding exposures (accounts >`5cr and as per RBI CRILC
reporting) as on March 31, 2019 stood at 0.98% of Gross Advances.
Outlook & Valuation: We have neutral view on YES Bank considering (a) low CET
of 8.4%, for growth, bank will have to raise capital at current low valuation, (b)
uncertainty related to newly identified stressed asset, (c) new MD strategy to move
towards building a strong retail franchise and corporate governance/transparency,
which will moderate balance sheet growth.
Apr 30, 2019
3
Yes Bank | Q4FY2019 Result Update
Income statement
Y/E March (` cr)
FY16
FY17
FY18
FY19
FY20E
FY21E
Net Interest Income
4,567
5,797
7,737
9,809
10,816
12,183
- YoY Growth (%)
31
27
33
27
10
13
Other Income
2,712
4,157
5,224
4,590
3,894
4,478
- YoY Growth (%)
33
53
26
(12)
(15)
15
Operating Income
7,279
9,954
12,961
14,399
14,710
16,662
- YoY Growth (%)
32
37
30
11
2
13
Operating Expenses
2,976
4,117
5,213
6,264
7,333
8,514
- YoY Growth (%)
30
38
27
20
17
16
Pre - Provision Profit
4,302
5,838
7,748
8,135
7,377
8,148
- YoY Growth (%)
32
36
33
5
(9)
10
Prov. & Cont.
536
793
1,554
5,778
3,472
3,034
- YoY Growth (%)
58
48
96
272
(40)
(13)
Profit Before Tax
3,766
5,044
6,194
2,357
3,905
5,114
- YoY Growth (%)
29
34
23
(62)
66
31
Prov. for Taxation
1,227
1,714
1,970
637
1,289
1,687
- as a % of PBT
33
34
32
27
33
33
PAT
2,539
3,330
4,225
1,720
2,617
3,426
- YoY Growth (%)
27
31
27
(59.28)
52
31
Source: Company
Balance sheet
Y/E March (` cr)
FY16
FY17
FY18
FY19
FY20E
FY21E
Equity
421
456
461
463
463
463
Reserve & Surplus
13,366
21,598
25,298
26,441
28,587
31,396
Networth
13,787
22,054
25,758
26,904
29,050
31,859
Deposits
1,11,720
1,42,874
2,00,738
2,27,610
2,64,089
3,06,508
- Growth (%)
23
28
41
13
16
16
Borrowings
31,659
38,607
74,894
1,08,424
1,23,603
1,40,908
Other Liab. & Prov.
8,098
11,525
11,056
17,888
16,819
19,481
Total Liabilities
1,65,263
2,15,060
3,12,446
3,80,826
4,33,562
4,98,757
Cash Balances
5,776
6,952
11,426
10,798
15,980
18,544
Bank Balances
2,442
12,597
13,309
16,092
18,439
21,397
Investments
48,838
50,032
68,399
89,522
95,881
1,11,266
Advances
98,210
1,32,263
2,03,534
2,41,500
2,77,725
3,19,383
- Growth (%)
30
35
54
19
15
15
Fixed Assets
471
684
832
817
1,229
1,426
Other Assets
9,526
12,532
14,946
22,098
24,308
26,739
Total Assets
1,65,263
2,15,060
3,12,446
3,80,826
4,33,562
4,98,757
- Growth (%)
21
30
45
22
14
15
Source: Company
Apr 30, 2019
4
Yes Bank | Q4FY2019 Result Update
Ratio analysis
Particular
FY16
FY17
FY18
FY19
FY20E
FY21E
Profitability ratios (%)
NIMs
3.3
3.4
3.3
3.1
3.0
2.9
Cost to Income Ratio
40.9
41.4
40.2
43.5
49.9
51.1
RoA
1.7
1.8
1.6
0.5
0.6
0.7
RoE
19.9
18.6
17.7
6.5
9.4
11.2
B/S ratios (%)
CASA Ratio
0.28
0.36
0.36
0.33
0.34
0.34
Credit/Deposit Ratio
0.9
0.9
1.0
1.1
1.1
1.0
Asset Quality (%)
Gross NPAs
0.76
1.52
1.28
3.22
3.22
3.00
Gross NPAs (Amt)
749
2,018
2,626
7,882
8,942
9,581
Net NPAs
0.29
0.81
0.64
1.86
1.75
1.50
Net NPAs (Amt)
284
1,072
1,312
4,484
4,860
4,790
Credit Cost on Advance
0.55
0.60
0.76
1.10
1.25
0.95
Provision Coverage
62%
47%
50%
43%
46%
50%
Per Share Data (`)
EPS
11.0
14.5
18.3
7.5
11.4
14.9
BV
59.9
95.8
111.8
116.8
126.1
138.3
ABVPS (70% cover.)
59.6
93.7
109.6
107.6
116.7
130.0
DPS
2.0
2.4
2.7
1.3
2.0
2.7
Valuation Ratios
PER (x)
15.1
11.5
9.1
22.4
14.7
11.2
P/BV
2.8
1.7
1.5
1.4
1.32
1.21
P/ABVPS (x)
2.8
1.8
1.5
1.6
1.43
1.28
Dividend Yield
1.2
1.4
1.6
0.8
1.2
1.6
Note - Valuation done on closing price of 30/04/2019
Apr 30, 2019
5
Yes Bank | Q4FY2019 Result Update
Research Team Tel: 022 - 39357800
Angel Broking Limited (hereinafter referred to as “Angel”) is a registered Member of National Stock Exchange of India Limited, Bombay
Stock Exchange Limited, Metropolitan Stock Exchange Limited, Multi Commodity Exchange of India Ltd and National Commodity &
Derivatives Exchange Ltd It is also registered as a Depository Participant with CDSL and Portfolio Manager and Investment Adviser with
SEBI. It also has registration with AMFI as a Mutual Fund Distributor. Angel Broking Limited is a registered entity with SEBI for Research
Analyst in terms of SEBI (Research Analyst) Regulations, 2014 vide registration number INH000000164. Angel or its associates has not
been debarred/ suspended by SEBI or any other regulatory authority for accessing /dealing in securities Market. Angel or its
associates/analyst has not received any compensation / managed or co-managed public offering of securities of the company covered
by Analyst during the past twelve months.
This document is solely for the personal information of the recipient, and must not be singularly used as the basis of any investment
decision. Nothing in this document should be construed as investment or financial advice. Each recipient of this document should
make such investigations as they deem necessary to arrive at an independent evaluation of an investment in the securities of the
companies referred to in this document (including the merits and risks involved), and should consult their own advisors to determine
the merits and risks of such an investment.
Reports based on technical and derivative analysis center on studying charts of a stock's price movement, outstanding positions and
trading volume, as opposed to focusing on a company's fundamentals and, as such, may not match with a report on a company's
fundamentals. Investors are advised to refer the Fundamental and Technical Research Reports available on our website to evaluate the
contrary view, if any
The information in this document has been printed on the basis of publicly available information, internal data and other reliable
sources believed to be true, but we do not represent that it is accurate or complete and it should not be relied on as such, as this
document is for general guidance only. Angel Broking Limited or any of its affiliates/ group companies shall not be in any way
responsible for any loss or damage that may arise to any person from any inadvertent error in the information contained in this report.
Angel Broking Limited has not independently verified all the information contained within this document. Accordingly, we cannot testify,
nor make any representation or warranty, express or implied, to the accuracy, contents or data contained within this document. While
Angel Broking Limited endeavors to update on a reasonable basis the information discussed in this material, there may be regulatory,
compliance, or other reasons that prevent us from doing so.
This document is being supplied to you solely for your information, and its contents, information or data may not be reproduced,
redistributed or passed on, directly or indirectly.
Neither Angel Broking Limited, nor its directors, employees or affiliates shall be liable for any loss or damage that may arise from or in
connection with the use of this information.
Disclosure of Interest Statement
Yes Bank
1. Financial interest of research analyst or Angel or his Associate or his relative
No
2. Ownership of 1% or more of the stock by research analyst or Angel or associates or relatives
No
3. Served as an officer, director or employee of the company covered under Research
No
4. Broking relationship with company covered under Research
No
Apr 30, 2019
6